
(video)Simon Sinek has a simple but powerful model for inspirational leadership all starting with a golden circle and the question “Why?” His examples include Apple, Martin Luther King, and the Wright brothers.
Simon Sinek, asks, Why are some people and organizations more innovative, more influential, and more profitable than others? Why do some command greater loyalty?
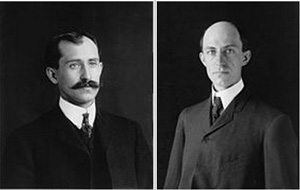
Orville and Wilbur Wright in 1903
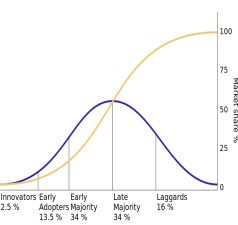 Diffusion of Innovations is a theory that seeks to explain how, why, and at what rate new ideas and technology spread through cultures. Everett Rogers, a professor of rural sociology, popularized the theory in his 1962 book Diffusion of Innovations. He said diffusion is the process by which an innovation is communicated through certain channels over time among the members of a social system. Some folks with a marketing background may have heard of this law.
This model was a factor in “The Tipping Point” by Malcolm Gladwell. The graph suggests that you need 16% to begin a trend. This is the point at which a trend catches fire – spreading exponentially through the population. Sometimes our sales team reports they win 10% of the opportunities. Is that good?
Does your Team complete a “Win/Lose Analysis”; most firms don’t. Many product managers have sophisticated software to perform win/loss. These analytics review your track record in selling to customers to determine what works and what doesn’t. This post review of your company’s performance encompasses all the critical facets related to winning business.
The Win/Loss Analysis is comprised of obtaining critical information related to the sales process and why you won or lost the sale. In the Win/Loss Analysis, team members collect vital information about the sales process and what the key constituents thought about why they did or did not buy from your company. The Win/Loss analysis includes a number of key criteria useful in measuring and monitoring your businesses success versus the competition.
In operations they measure, respond, adjust, adapt and improve; what metrics do we use in sales? Conversion Rate (And Channel Conversion Rate)
Simply put, this is the percentage of leads that convert to actual sales. Otherwise known as your close rate, you can track conversion rates for other things, like newsletter signups, but in this context we’re tracking sales.
Ideally, you should know your average conversion rate across your entire business, as well as breaking this out into the varying channels and methods you’re using to generate leads.
The Law of Diffusion of Innovation, The Hawthorne Principle and Heisenberg’s uncertainty principle all are a part of sales metrics, planning and the improving. Metrics are a key to growing your business.
“A business metric is any type of measurement used to gauge some quantifiable component of a company’s performance, such as return on investment (ROI), employee and customer churn rates, revenues, EBITDA, and so on. Business metrics are part of the broad area of business intelligence, which comprises a wide variety of applications and technologies for gathering, storing, analyzing, and providing access to data to help enterprise users make better business decisions.
Systematic approaches, such as the balanced scorecard methodology, can be employed to transform an organization’s mission statement and business strategy into specific and quantifiable goals, and to monitor the organization’s performance in terms of achieving those goals.”
What is your conversation rate? Do you convert more that 10% of your leads?
Leave a Reply